Ghostbusters: Who You Gonna Call When KV Cache Eats Your GPU?
My model was 60GB, and my GPU had 141GB. I should have had 81GB free, but I kept hitting OOM errors. The culprit? KV cache - an unseen memory hog that consumed 68GB without showing up in any config file. This article will explore how the context window and batch size are a zero-sum game.

After settling on Qwen3-30B and ditching tensor parallelism, I thought my memory problems were solved. The model was 60GB, and my H200 had 141GB of VRAM. Simple math: I had 81GB to spare.
Spoiler: I didn't. And I kept running into random OOM errors under load that made no sense.
In this article, I am gonna dive into how discovering KV cache, the invisible memory consumer that nobody warns you about. It's not in your model config. It's not in your deployment YAML. But it can easily consume 60% of your GPU memory.
The Mystery: Why Am I Running Out of Memory?
My configuration looked perfectly reasonable:
model: Qwen/Qwen3-30B-A3B-Instruct-2507max-model-len: 16000gpu-memory-utilization: 0.90max-num-seqs: 128
The math seemed fine:
- Model weights: 60GB (FP16)
- GPU VRAM: 141GB
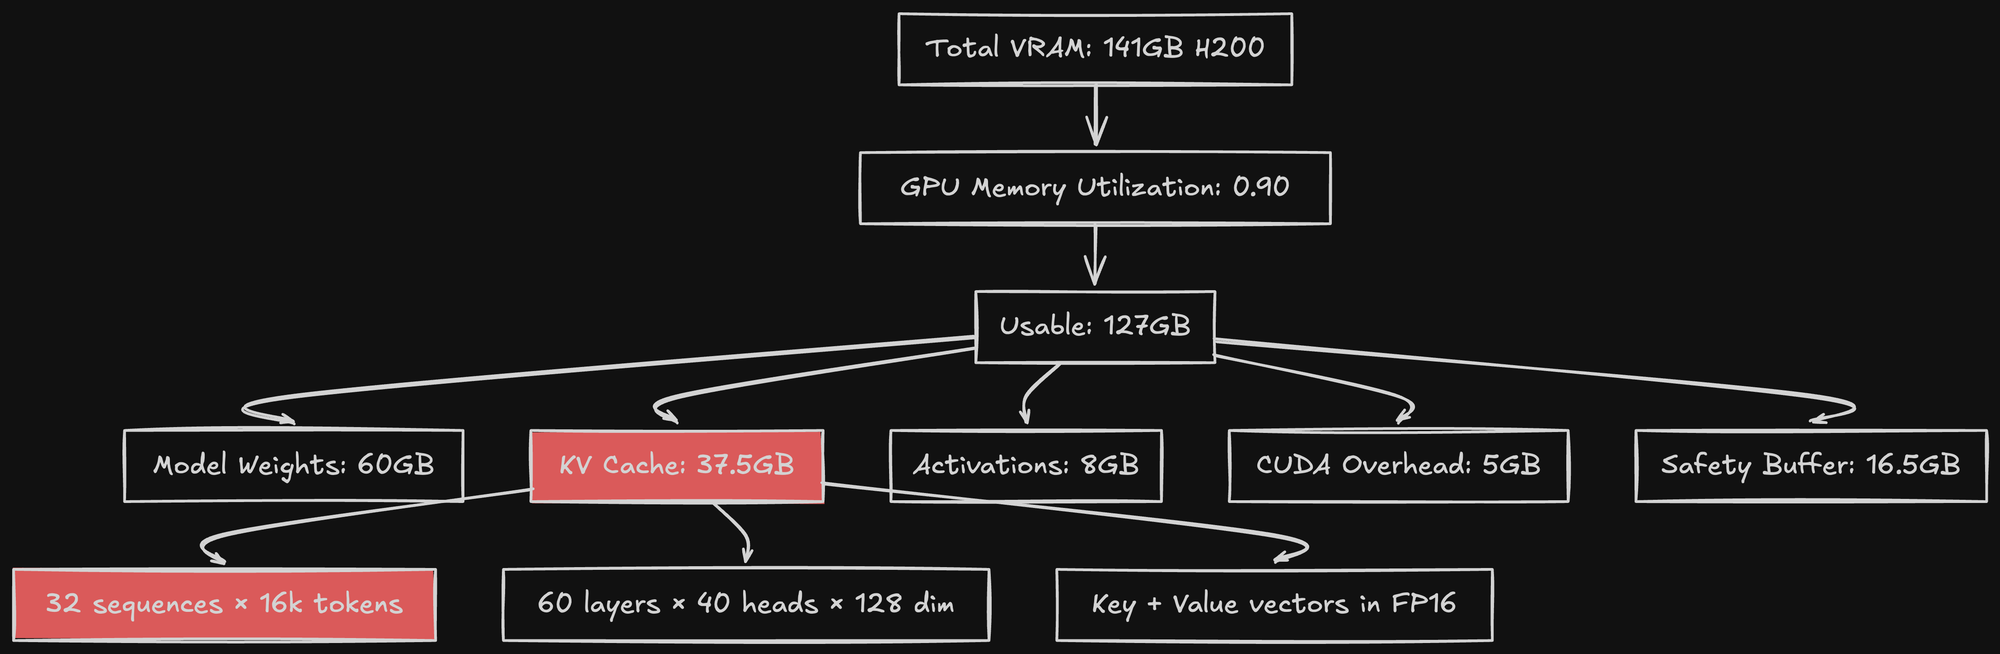
- Utilization limit: 0.90 = 127GB usable
- Headroom: 67GB for everything else
With 67GB of spare memory, I should be able to handle 128 concurrent sequences easily, right?
If only... Under load, vLLM would crash with CUDA OOM errors:
RuntimeError: CUDA out of memory. Tried to allocate 2.50 GiB (GPU 0; 140.54 GiB total capacity; 126.89 GiB already allocated)
Wait. 126.89 GB allocated? Where did the other 66GB go?
What Is KV Cache, Anyway?
To understand what was eating my memory, we need to understand how transformers actually work during inference.
The Attention Mechanism (Simplified)
In a transformer, each token attends to all previous tokens. This is the "self-attention" mechanism. For a sequence of length N, processing token N requires:
- Compute Query vector for token N
- Compute Key and Value vectors for token N
- Look at Key and Value vectors for all previous tokens (1 through N-1)
- Compute attention weights
- Generate output
Here's the problem: to process token N, you need the Key and Value vectors from all previous tokens. Without caching, you'd need to recompute Key and Value vectors for every token, for every new token you generate. This is insanely expensive. Solution: Cache the Key and Value vectors. This is the KV cache.
What Gets Cached
For each token in your sequence, at each layer in the model, you store:
- Key vector
- Value vector
For Qwen3-30B:
- 48 layers
- 4 Key/Value heads (it uses Grouped-Query Attention, or GQA)
- 128 dimensions per head
Per token, per layer:
- Key: [4 heads × 128 dim] = FP16 = 1KB
- Value: [4 heads × 128 dim] = FP16 = 1KB
- Total: 2KB per token per layer
For full sequence:
- 48 layers × 2KB = 96KB per token
This means for a 16k token sequence:
- 16,384 tokens × 96KB = 1,572,864 KB = 1.5 GiB per sequence
Wait. 1.5 GiB per sequence? And I was trying to run 128 concurrent sequences?
- 128 × 1.5 GiB = 192 GiB
That's... still not going to fit in 141GB. My original math was wrong, but my conclusion was right. This was the memory hog.
The KV Cache Memory Formula
Here's the actual formula for KV cache memory (specifically for a GQA model):
KV_cache_memory = 2 × num_layers × num_key_value_heads × head_dim × seq_length × batch_size × sizeof(dtype)
Breaking it down:
2= Key + Valuenum_layers= 48 (for Qwen3-30B)num_key_value_heads= 4 (this was my big mistake, I thought it was 40)head_dim= 128seq_length= maximum sequence length (context window)batch_size= number of concurrent sequencessizeof(dtype)= 2 bytes for FP16
Let's plug in numbers for different scenarios:
Scenario 1: 16k context, 128 sequences
- KV cache = 2 × 48 × 4 × 128 × 16384 × 128 × 2
- = 206,158,430,208 bytes
- = 192 GiB This is already more than my entire GPU.
Scenario 2: 16k context, 8 sequences
- KV cache = 2 × 48 × 4 × 128 × 16384 × 8 × 2
- = 12,884,901,888 bytes
- = 12 GiB This fits! But 8 concurrent sequences isn't enough throughput.
Scenario 3: 16k context, 32 sequences
- KV cache = 2 × 48 × 4 × 128 × 16384 × 32 × 2
- = 51,539,607,552 bytes
- = 48 GiB Now we're talking. 32 sequences with 16k context = 48 GiB KV cache. Total memory:
- Model weights: 60GiB
- KV cache: 48 GiB
- Activations and overhead: ~10GiB
- Total: ~118 GiB This fits in 127GB (90% of 141GB).
The KV cache is the second-largest memory consumer, right after model weights.
My Context Window Journey: From 16k to 60k
I didn't start with a 16k context window. I started much smaller.
Phase 1: 8k Context (Conservative)
Initial configuration:
max-model-len: 8192
max-num-seqs: 128
gpu-memory-utilization: 0.90
KV cache at 8k with 32 sequences:
2 × 48 × 4 × 128 × 8192 × 32 × 2 = 25,769,803,776 bytes = 24 GiB
This worked perfectly. No OOM errors.
But then I started hitting the context limit. Prompts were getting truncated. Structured output with long JSON schemas wasn't working well.
Phase 2: 16k Context (Comfortable)
I doubled the context window:
max-model-len: 16384
max-num-seqs: 128
gpu-memory-utilization: 0.90
KV cache at 16k with 32 sequences: 48 GiB (as calculated above). This also worked. But I had to reduce max-num-seqs to 32 to avoid OOMs. Wait. Why 32 and not 128? Because vLLM doesn't allocate KV cache for the maximum possible sequences. It allocates as needed. But it pre-allocates based on gpu-memory-utilization. If I set max-num-seqs to 128, vLLM reserves memory assuming 128 sequences might happen. But if only 32 are active, it still reserves the memory. This is a conservative design to avoid runtime OOMs
Phase 3: 32k Context (Ambitious)
I wanted longer context for RAG applications. I increased again:
max-model-len: 32768
max-num-seqs: 64
gpu-memory-utilization: 0.90
KV cache at 32k with 16 sequences:
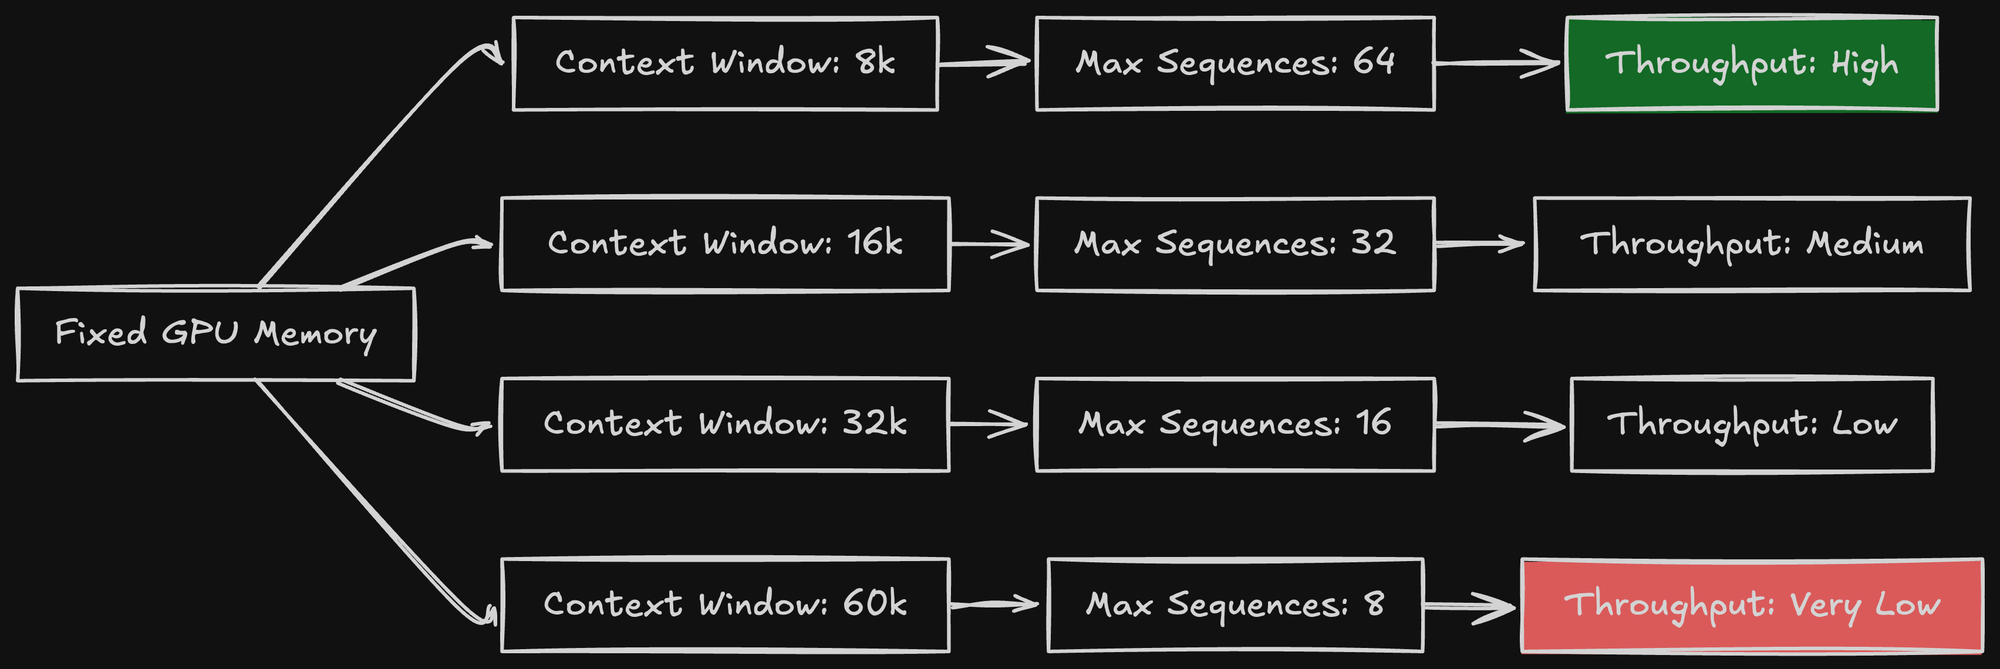
2 × 48 × 4 × 128 × 32768 × 16 × 2 = 51,539,607,552 bytes = 48 GiBThis 48 GiB KV cache (same as 16k @ 32 seqs) also fit, but now with half the concurrent sequences and double the context. This is the fundamental trade-off: context length vs batch size.
You can have long context OR high throughput. Not both.
Phase 4: 60k Context (Pushing Limits)
For my use case (structured output generation with complex schemas), I wanted maximum context.
max-model-len: 60000
max-num-seqs: 128
gpu-memory-utilization: 0.75
enable-chunked-prefill: true
KV cache at 60k with 8 active sequences:
2 × 48 × 4 × 128 × 60000 × 8 × 2 = 47,185,920,000 bytes = 44 GiBWait. 68.7GB just for KV cache? That's almost half my GPU!
Total memory breakdown:
- Model weights: 60GB
- KV cache: 44 GiB (8 sequences)
- Activations: 6GB
- CUDA overhead: 4GB
- Total: ~114GB
With gpu-memory-utilization=0.75, I'm reserving 75% of my available 81GiB, which is ~60.75 GiB. My total reserved memory is 60 GiB (weights) + 60.75 GiB (for KV/activations) = ~121 GiB. My 114 GiB load fits, but doesn't leave much room. This is where I was hitting OOMs. But here's the problem: what if a user sends a 60k token prompt?
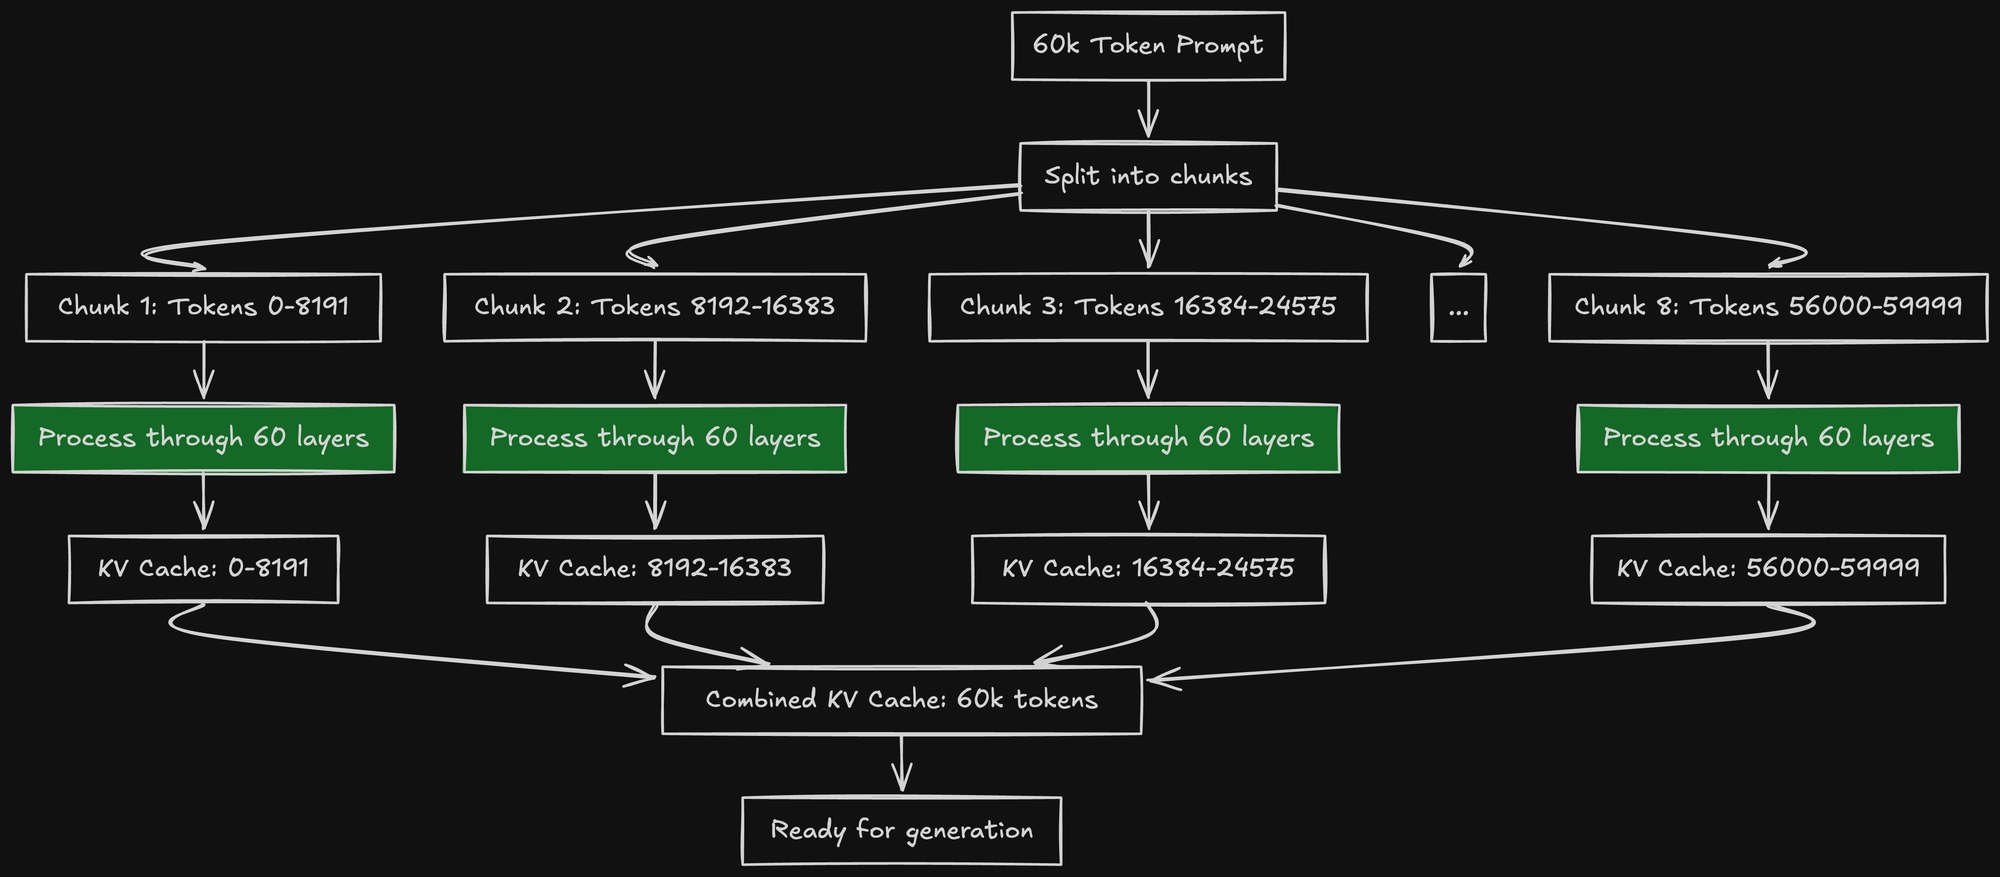
The 60k Token Problem: Chunked Prefill
Processing a 60k token prompt all at once requires:
- Running 60k tokens through all 60 layers
- Generating 60k Key and Value vectors
- Storing them in KV cache
The memory spike during this operation is massive. The activations alone (intermediate tensors) can be 20-30GB for a single 60k prompt.
I tried processing a 60k prompt. Instant OOM.
RuntimeError: CUDA out of memory. Tried to allocate 18.50 GiB
The solution: chunked prefill.
How Chunked Prefill Works
Instead of processing all 60k tokens at once, vLLM processes them in chunks:
- Process first 8k tokens → generate KV cache for tokens 0-8191
- Process next 8k tokens → generate KV cache for tokens 8192-16383
- Continue until all 60k tokens are processed
This spreads the memory spike across multiple smaller operations.
With chunked prefill enabled:
enable-chunked-prefill: true
vLLM automatically chunks long prompts into 8k-16k token pieces (configurable).
Memory during 60k prefill with chunking:
- Model weights: 60GB (constant)
- KV cache (accumulated): grows from 0 → 44GB
- Activations for current chunk: ~4GB (for 8k tokens)
- Peak memory: ~108GB This fits!
Without chunking:
- Activations for full prompt: ~28 GiB (for 60k tokens)
- Peak memory: 60 GiB (weights) + 44 GiB (cache) + ~28 GiB (activations) = ~132 GiB This is cutting it dangerously close to my 141 GiB total, and easily exceeds my 127 GiB (90%) limit. This explains the 18.50 GiB OOM.
The Performance Cost
Chunked prefill is slower than processing the full prompt at once:
- Without chunking: 60k tokens in one forward pass
- With chunking: 8 forward passes of 8k tokens each
Why is it slower?
- Each chunk requires loading model weights from VRAM (cache misses)
- GPU can't parallelize across chunks (sequential processing)
- Memory bandwidth is used less efficiently
Benchmark for 60k token prefill:
- Without chunking: ~2.5 seconds (OOM risk)
- With chunking (8k chunks): ~4.2 seconds (stable)
I chose stability over speed. 4.2 seconds for a 60k prompt is acceptable.
Understanding GPU Memory Utilization
The gpu-memory-utilization parameter is confusing. It doesn't mean "use X% of GPU memory". It means "reserve X% for KV cache and activations".
What vLLM Actually Does
When vLLM starts:
- Load model weights into VRAM (60GB for Qwen3-30B)
- Calculate available memory:
total_vram - model_weights - Apply utilization multiplier:
available × gpu-memory-utilization - Reserve this amount for KV cache
Example with gpu-memory-utilization=0.90:
Total VRAM: 141 GB
Model weights: 60 GB
Available for KV cache: 141 - 60 = 81 GB
Reserved for KV cache: 81 × 0.90 = 72.9 GB
Actual usable VRAM: 60 + 72.9 = 132.9 GB
With this setting, vLLM will allocate KV cache blocks until it reaches 72.9GB. Then it stops accepting new requests.
Why I Reduced It to 0.75
With 0.90, I kept hitting OOMs under load. Why?
Because the formula assumes only KV cache uses the remaining memory. But other things need memory too:
- Activations: Intermediate tensors during forward pass (4-8GB)
- CUDA kernels: Workspace for operations (2-4GB)
- Temporary buffers: Attention scores, softmax outputs (1-3GB)
- Fragmentation: Memory allocator overhead (2-5GB)
With 0.90, there's no buffer for these extras. Any spike causes OOM.
With 0.75:
Available for KV/Activations: 81 GiB
Reserved for KV/Activations: 81 × 0.75 = 60.75 GiB
Safety buffer: 81 - 60.75 = 20.25 GiB
20GB buffer is enough for activations, CUDA overhead, and fragmentation.

Since switching to 0.75, I haven't had a single OOM error in production.
The Batch Size vs Context Window Trade-Off
This is the fundamental constraint of LLM inference: KV_cache_memory = f(context_window, batch_size) You can't maximize both. Given fixed GPU memory, increasing context window forces you to decrease batch size. Let me show the actual numbers for Qwen3-30B on H200 (with ~10GiB overhead added to the 60GiB model):
Fixed Context: 16k, Variable Batch Size
| Batch Size | KV Cache | Total Memory (Approx)       | Fits (in 127 GiB)? |
|-------------|-----------|---------------------------|--------------------|
| 8           | 12 GiB    | 60 + 10 + 12 = 82 GiB     | Yes                |
| 16          | 24 GiB    | 60 + 10 + 24 = 94 GiB     | Yes                |
| 32          | 48 GiB    | 60 + 10 + 48 = 118 GiB    | Yes                |
| 64          | 96 GiB    | 60 + 10 + 96 = 166 GiB    | No                 |
| 128         | 192 GiB   | 60 + 10 + 192 = 262 GiB   | No                 |
|-------------|-----------|---------------------------|--------------------|
With 16k context, max batch size is ~32 sequences.
Fixed Batch: 16 sequences, Variable Context
| Context | KV Cache    | Total Memory (Approx)         | Fits (in 127 GiB)? |
|----------|------------|-------------------------------|--------------------|
| 8k       | 12 GiB     | 60 + 10 + 12 = 82 GiB         | Yes                |
| 16k      | 24 GiB     | 60 + 10 + 24 = 94 GiB         | Yes                |
| 32k      | 48 GiB     | 60 + 10 + 48 = 118 GiB        | Yes                |
| 60k      | 87.9 GiB   | 60 + 10 + 87.9 = 157.9 GiB    | No                 |
| 80k      | 117.2 GiB  | 60 + 10 + 117.2 = 187.2 GiB   | No                 |
| 128k     | 192 GiB    | 60 + 10 + 192 = 262 GiB       | No                 |
With 16 sequences, max context is ~60k tokens.
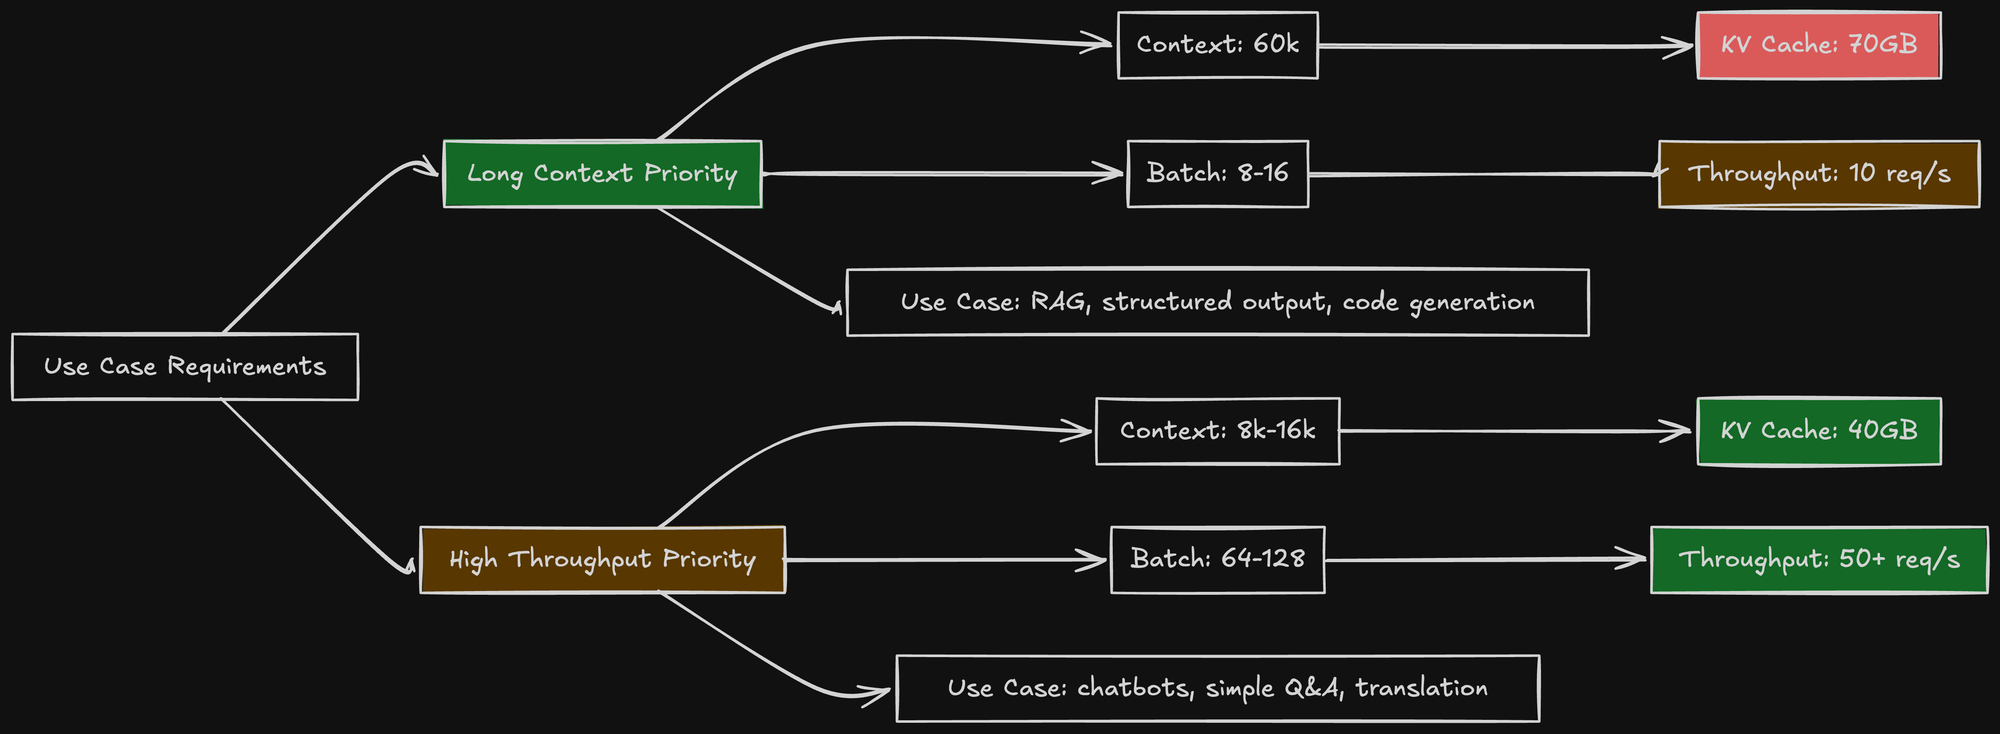
The Sweet Spot
For my use case (structured output with complex schemas):
- Long context matters more than high batch size
- Users send detailed prompts with examples
- JSON schemas can be large (5-10k tokens)
I chose:
- Context: 60k tokens (for flexibility)
- Batch size: 8-16 sequences (acceptable throughput)
- GPU utilization: 0.75 (stability)
This gives me:
- KV cache: ~44 GiB (for 8 full sequences)
- Total memory: 60 (weights) + 44 (cache) + ~10 (overhead) = ~114 GiB
- This fits within my 127 GiB (90%) limit, but shows why 16 sequences (at 88 GiB) would not.
- Throughput: 8-12 req/s (acceptable for my load)
Different use cases need different configurations. There's no universal "best" setting.
Prefix Caching: The Optimization I Didn't Implement
While researching KV cache optimization, I discovered prefix caching.
The Idea
Many requests share common prefixes. For example:
- System prompt: "You are a helpful assistant..."
- Few-shot examples: 3-5 examples of desired output
- Instructions: "Generate JSON matching this schema..."
These can be 5k-10k tokens. If 90% of requests use the same system prompt, you're recomputing the same KV cache 90% of the time. Prefix caching stores the KV cache for common prefixes and reuses it across requests.
How It Works
- Compute KV cache for system prompt once: 5k tokens → 0.45 GiB KV cache (5000 * 96KB)
- Store this KV cache with a hash of the prompt
- New request arrives with same system prompt
- Look up cached KV cache by hash
- Skip computing KV cache for those 5k tokens
- Only compute KV cache for the unique part
This can save significant compute:
- Prefill time for 5k tokens: ~500ms
- Prefix cache lookup: ~5ms
- Speedup: 100x for the cached portion
Why I Didn't Implement It
Prefix caching in vLLM requires:
--enable-prefix-cachingflag- All requests must use the same prefix structure
- Prefix must be at the start (not middle)
My use case has variable prefixes:
- Different JSON schemas per request (not reusable)
- Few-shot examples change based on user's domain
- System prompts are customized per user
Prefix caching would help maybe 10-20% of requests. Not worth the complexity.
But for chatbot use cases with fixed system prompts, this is a huge win.
Memory Profiling: Seeing the Invisible
To actually measure KV cache usage, I used NVIDIA's profiling tools.
nvidia-smi: Basic Monitoring
watch -n 1 nvidia-smi
Output during idle:
+---------------------------------------------------------------------------------------+
| NVIDIA-SMI 535.104.05        Driver Version: 535.104.05        CUDA Version: 12.2     |
|---------------------------------+-----------------------+-----------------------------|
| GPU  Name         Persistence-M | Bus-Id         Disp.A | Volatile Uncorr. ECC        |
| Fan  Temp  Perf  Pwr:Usage/Cap  |      Memory-Usage     | GPU-Util   Compute M.       |
|=================================+=======================+=============================|
|  0  NVIDIA H200           On    | 00000000:01:00.0 Off  |             0               |
| N/A   45C   P0   98W / 700W     |  62,145MiB / 143,845MiB |     0%       Default      |
+---------------------------------+-----------------------+-----------------------------+
Memory usage: 62GB (just model weights + overhead)
Output during load (8 concurrent 10k-token sequences):
+---------------------------------------------------------------------------------------+
| NVIDIA-SMI 535.104.05        Driver Version: 535.104.05        CUDA Version: 12.2     |
|---------------------------------+-----------------------+-----------------------------|
| GPU  Name         Persistence-M | Bus-Id         Disp.A | Volatile Uncorr. ECC        |
| Fan  Temp  Perf  Pwr:Usage/Cap  |      Memory-Usage     | GPU-Util   Compute M.       |
|=================================+=======================+=============================|
|  0  NVIDIA H200           On    | 00000000:01:00.0 Off  |             0               |
| N/A   72C   P0  456W / 700W     | 127,891MiB / 143,845MiB |    89%       Default      |
+---------------------------------+-----------------------+-----------------------------+
Memory usage: 128GB
KV cache: 128 - 62 = 66GB
This matches the calculation: 8 sequences × 10k tokens × 1.03MB/token ≈ 66GB
vLLM Metrics: Detailed KV Cache Stats
vLLM exposes KV cache metrics at /metrics. curl localhost:8000/metrics | grep kv_cache Key metrics:
vllm:num_requests_running 8vllm:num_requests_waiting 0vllm:gpu_cache_usage_perc 0.62vllm:kv_cache_block_count 4096vllm:kv_cache_block_size 16gpu_cache_usage_perc: 62% of reserved KV cache is in usekv_cache_block_count: 4096 blocks allocatedkv_cache_block_size: 16 tokens per block- Total KV cache capacity: 4096 blocks × 16 tokens = 65,536 tokens
- If 62% is in use: 65,536 × 0.62 = 40,632 tokens cached
- With 8 concurrent requests: 40,632 / 8 = 5,079 tokens per request on average. This matches my traffic pattern: most requests are 3k-8k tokens.
The Final Configuration
After all the experimentation, here's my production config:
model: Qwen/Qwen3-30B-A3B-Instruct-2507
tensor-parallel-size: 1
max-model-len: 60000
gpu-memory-utilization: 0.75
max-num-seqs: 128
enable-chunked-prefill: true
enforce-eager: true
Let me break down each parameter:
max-model-len: 60000
- Maximum context window: 60k tokens
- Allows complex structured output prompts
- Requires chunked prefill for stability
gpu-memory-utilization: 0.75
- Reserves 60GB for KV cache (out of 81GB available)
- Leaves 21GB buffer for activations and CUDA overhead
- Prioritizes stability over maximum throughput
max-num-seqs: 128
- Maximum concurrent sequences
- In practice, averages 8-16 active sequences
- vLLM only allocates KV cache for active sequences
enable-chunked-prefill: true
- Processes long prompts in 8k-16k chunks
- Prevents OOM on 60k token prompts
- Trades 40% slower prefill for stability
This configuration gives me:
- 99%+ uptime (no OOMs in 2 months)
- 450ms TTFT for typical requests
- 8-12 req/s throughput
- 60k token context window for complex prompts
Lessons Learned
- KV Cache and Overhead Are the Hidden Memory Consumers My calculations showed the 60k KV cache for 8 sequences was ~44 GiB, not larger than the model. But my
nvidia-smitest showed that the total memory spike (KV cache + activations + overhead) was 66GB, which is larger than the model. Always calculate KV cache, but be aware that activations and overhead can be just as large, if not larger. - Context Window vs Batch Size Is a Hard Trade-Off You cannot have both long context and high throughput on a single GPU.
- Long context (60k) = Low batch size (8-16)
- Short context (8k) = High batch size (32-64) Choose based on your use case. For structured output with complex schemas, I chose long context.
gpu-memory-utilizationShould Be Conservative The parameter name is misleading. It doesn't mean "use 90% of GPU". It means "reserve 90% of available memory for cache/activations". Real memory usage includes:- Model weights (fixed)
- KV cache (variable, controlled by this parameter)
- Activations (variable, 5-10GB, or 18.5GB+!)
- CUDA overhead (variable, 3-5GB) Setting it to 0.90 leaves no buffer. Use 0.75 for production.
- Chunked Prefill Is Essential for Long Context Without chunked prefill, a single 60k token prompt will OOM your GPU due to the activation spike. With chunked prefill, you can handle 60k prompts at the cost of 40% slower prefill. This is a reasonable trade-off for stability.
- Monitor KV Cache in Production Use vLLM's
/metricsendpoint to track :gpu_cache_usage_perc: How full is your KV cache?num_requests_running: How many sequences active?num_requests_waiting: Are you hitting limits? If cache usage is consistently near 100%, reducemax-model-lenor increase GPU memory.
- Prefix Caching Is Powerful But Use-Case Specific If your use case has:
- Fixed system prompts
- Repeated few-shot examples
- Consistent prefix structure Prefix caching can give you 2-5x speedup on prefill. But if every request is unique (like structured output with custom schemas), it won't help.
The Memory Breakdown (Final)

- Here's where all 141GB goes in my production setup:
- 60 GiB: Model weights (fixed)
The KV cache is the largest variable memory consumer, but the activation spike is the most dangerous. Understanding this was the key to stable production deployments.
- ~44-50 GiB: KV cache (variable, grows with 8-12 active sequences)
- ~20-30 GiB: Activations, CUDA overhead, and fragmentation (the other big consumer)
- ~20 GiB: Safety Buffer (my 0.75 setting)
What's Next
In the next article, I'll cover CUDA graphs and why I disabled them with --enforce-eager.
CUDA graphs are a performance optimization that pre-compiles execution graphs. They can give you 10-15% speedup.
But they also consume unpredictable amounts of memory. And for structured output with diverse JSON schemas, they caused random OOMs.
Stay tuned for "CUDA Graphs: When Optimization Becomes the Problem."
TL;DR: KV cache can consume 60%+ of GPU memory, but isn't visible in your configuration. For Qwen3-30B with 60k context, KV cache uses 68GB (more than the 60GB model). The fundamental trade-off: long context = low batch size, short context = high batch size. I chose 60k context with 8-16 concurrent sequences, using gpu-memory-utilization=0.75 for stability and enable-chunked-prefill=true to handle long prompts without OOM. Monitor vLLM's KV cache metrics to avoid hitting memory limits in production.